Wednesday, July 30, 2008

Star Plots

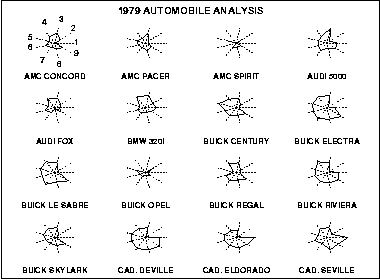
The star plot consists of a sequence of equi-angular spokes, called radii, with each spoke representing one of the variables. The data length of a spoke is proportional to the magnitude of the variable for the data point relative to the maximum magnitude of the variable across all data points. A line is drawn connecting the data values for each spoke. This gives the plot a star-like appearance and the origin of the name of this plot.
The star plot is a method of displaying multivariate data. Each star represents a single observation. Typically, star plots are generated in a multi-plot format with many stars on each page and each star representing one observation.
Star plots are used to examine the relative values for a single data point (e.g., point 3 is large for variables 2 and 4, small for variables 1, 3, 5, and 6) and to locate similar points or dissimilar points.

In diagram: The plot abve contains the star plots of 16 cars. The data file actually contains 74 cars, but we restrict the plot to what can reasonably be shown on one page. The variable list for the sample star plot is 1=Price, 2=Mileage (MPG), 3=1978 Repair Record (1 = Worst, 5 = Best), 4= 1977 Repair Record (1 = Worst, 5 = Best), 5=Headroom, 6= Rear Seat Room, 7=Trunk Space, 8= weight, and 9= Length

Correlation Matrix


A Correlation Matrix is a graphical representation of the correlation between two numeric variables.

Similarity matrix


A similarity matrix is a matrix of scores which express the similarity between two data points.

Stem and Leaf Plot

A Stem and Leaf Plot resembles a histogram turned on its side. It shows the shape and distribution of values in data sets. The value written in first in the row is referred to as the stem and the number following that value are referred to as the leaves. For instance, the first value is 55; the next value is three then the total distribution of the values would be 553. Simply take the stem and add it to the leaf. Another example, the number 38 would be stem: 3 and Leaf: 8.

Box Plot


A boxplot is a way of summarizing a set of data measured on an interval scale. It is often used in exploratory data analysis. It is a type of graph which is used to show the shape of the distribution, its central value, and variability. The picture produced consists of the most extreme values in the data set (maximum and minimum values), the lower and upper quartiles, and the median.

(Definition taken from Valerie J. Easton and John H. McColl's Statistics Glossary v1.1)

Histogram


A Histogram displays variable with data that occurs at a given frequency.

Parallel Coordinate Plot


A Parallel Coordiante Plot: A methodology for visualizing analytic and synthetic geometry in RN is presented. It is based on a system of parallel coordinates which induces a nonprojective mapping between N-dimensional and two-dimensional sets. Hypersurfaces are represented by their planar images which have some geometrical properties analogous to the properties of the hypersurface that they represent. A point ← → line duality when N=2 generalizes to lines and hyperplanes enabling the representation of polyhedra in R N. The representation of a class of convex and non-convex hypersurfaces is discussed, together with an algorithm for constructing and displaying any interior point. The display shows some local properties of the hypersurface and provides information on the point's proximity to the boundary.
- Parallel coordinates: a tool for visualizing multi-dimensionalgeometry;
Inselberg, A.; Dimsdale, B.